
Understanding Settings
Clear subheading for enhanced understanding
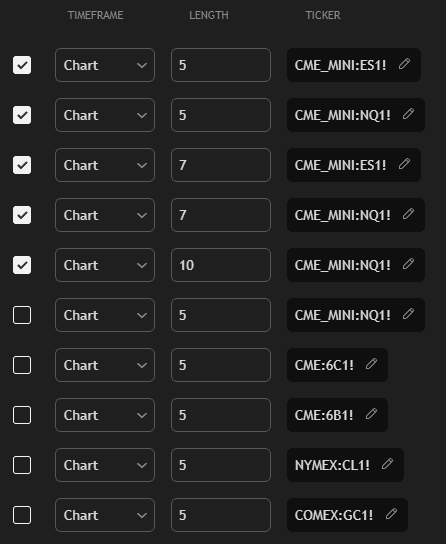
Timeframe:
Allows you to set the timeframe for each ticker (e.g., chart-level analysis).
Example: The timeframe for all tickers is currently set to Chart, meaning it adapts to the timeframe of your active chart.
Length:
Defines the number of candles used for calculations (e.g., 5).
Purpose: Determines how much data the screener considers for signals.
Ticker:
Lists the assets the screener monitors (e.g., S&P Futures - CME_MINI:ES1!, Nasdaq Futures - CME_MINI:NQ1!, etc.).
Purpose: Tracks multiple instruments simultaneously.
Max Lookback:
Defines the number of bars the screener scans in the past (e.g., 10,000 bars).
Purpose: Ensures the screener reviews sufficient historical data for accurate signals.

ATR & Macro Settings
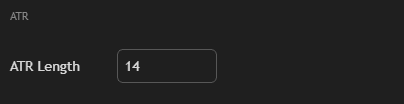
ATR Length:
14 is set as the Average True Range (ATR) period.
Purpose: Measures market volatility over the past 14 candles for each ticker.
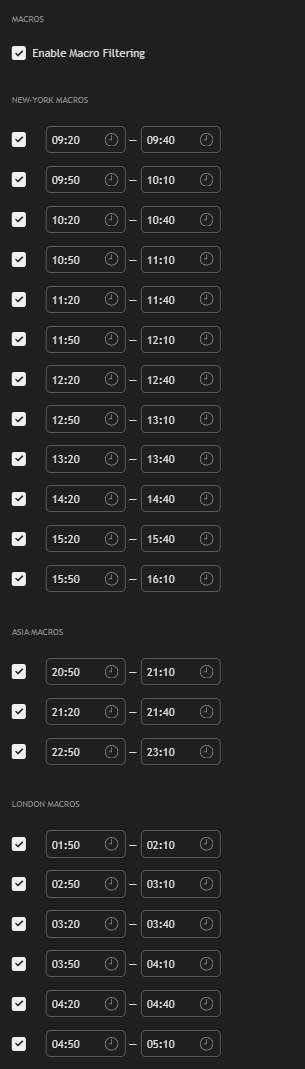
Enable Macro Filtering:
Filters signals based on specific time slots (e.g., New York, Asia, London sessions).
Purpose: Focuses on trades during high-activity periods.
New York Macros:
Time intervals are defined for key New York session periods (e.g., 09:20–09:40, 09:50–10:10, etc.).
Purpose: Targets potential trading opportunities during the active New York session.
Asia Macros:
Monitors the market during Asia session times (e.g., 20:50–21:10, etc.).
London Macros:
Focuses on trading signals during London session times (e.g., 01:50–02:10, etc.).
Purpose: Provides opportunities during globally active trading hours.
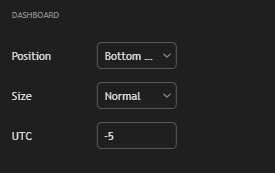
Dashboard
Position:
Sets the location of the dashboard on your chart (e.g., Top Right).
Size:
Adjusts the dashboard's visual size (e.g., Normal).
UTC:
Defines the timezone offset for time-based signals (e.g., -5 UTC for EST).
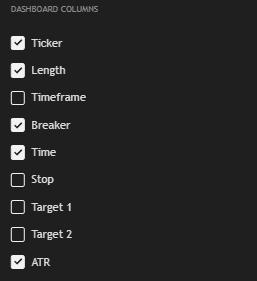
Dashboard Columns:
Ticker: Displays the asset name.
Length: Number of bars used for calculations.
Timeframe: The timeframe being monitored.
Breaker: Highlights any breaker levels detected.
Time: Shows when signals occur.
Stop, Target 1, Target 2: Displays calculated stop-loss and profit targets.
ATR: Shows the volatility for each asset.
Last Updated:
